Low-Lying Places
Elevation maps derived from DEM (digital elevation model) data give us a sense for where sea level rise will generally impact. The maps below highlight areas below 1.5 ft and 3 ft of elevation in the study area. If sea level were to rise 3 ft, for example, the elevation at 3 ft above current sea level would be inundated by the new average sea level. However, the tidal range and storm surges would lead to more land being affected. Also, elevation is only one factor affecting inundation. Other factors include “protection” measures for the built environment, such as seawalls.
 Critical Facilities in Low-Lying Places – areas below 1.5 ft and 3 ft of elevation in the study area. Critical facilities highlighted on the map include hospitals, schools, and emergency services.

St. Augustine Low-Lying Places – areas below 1.5 ft and 3 ft of elevation in St. Augustine.
 Anastasia Island Low-Lying Places – areas below 1.5 ft and 3 ft of elevation on and around Anastasia Island.
 Flagler Beaches Low-Lying Places – areas below 1.5 ft and 3 ft of elevation on and around the Flagler Beaches.
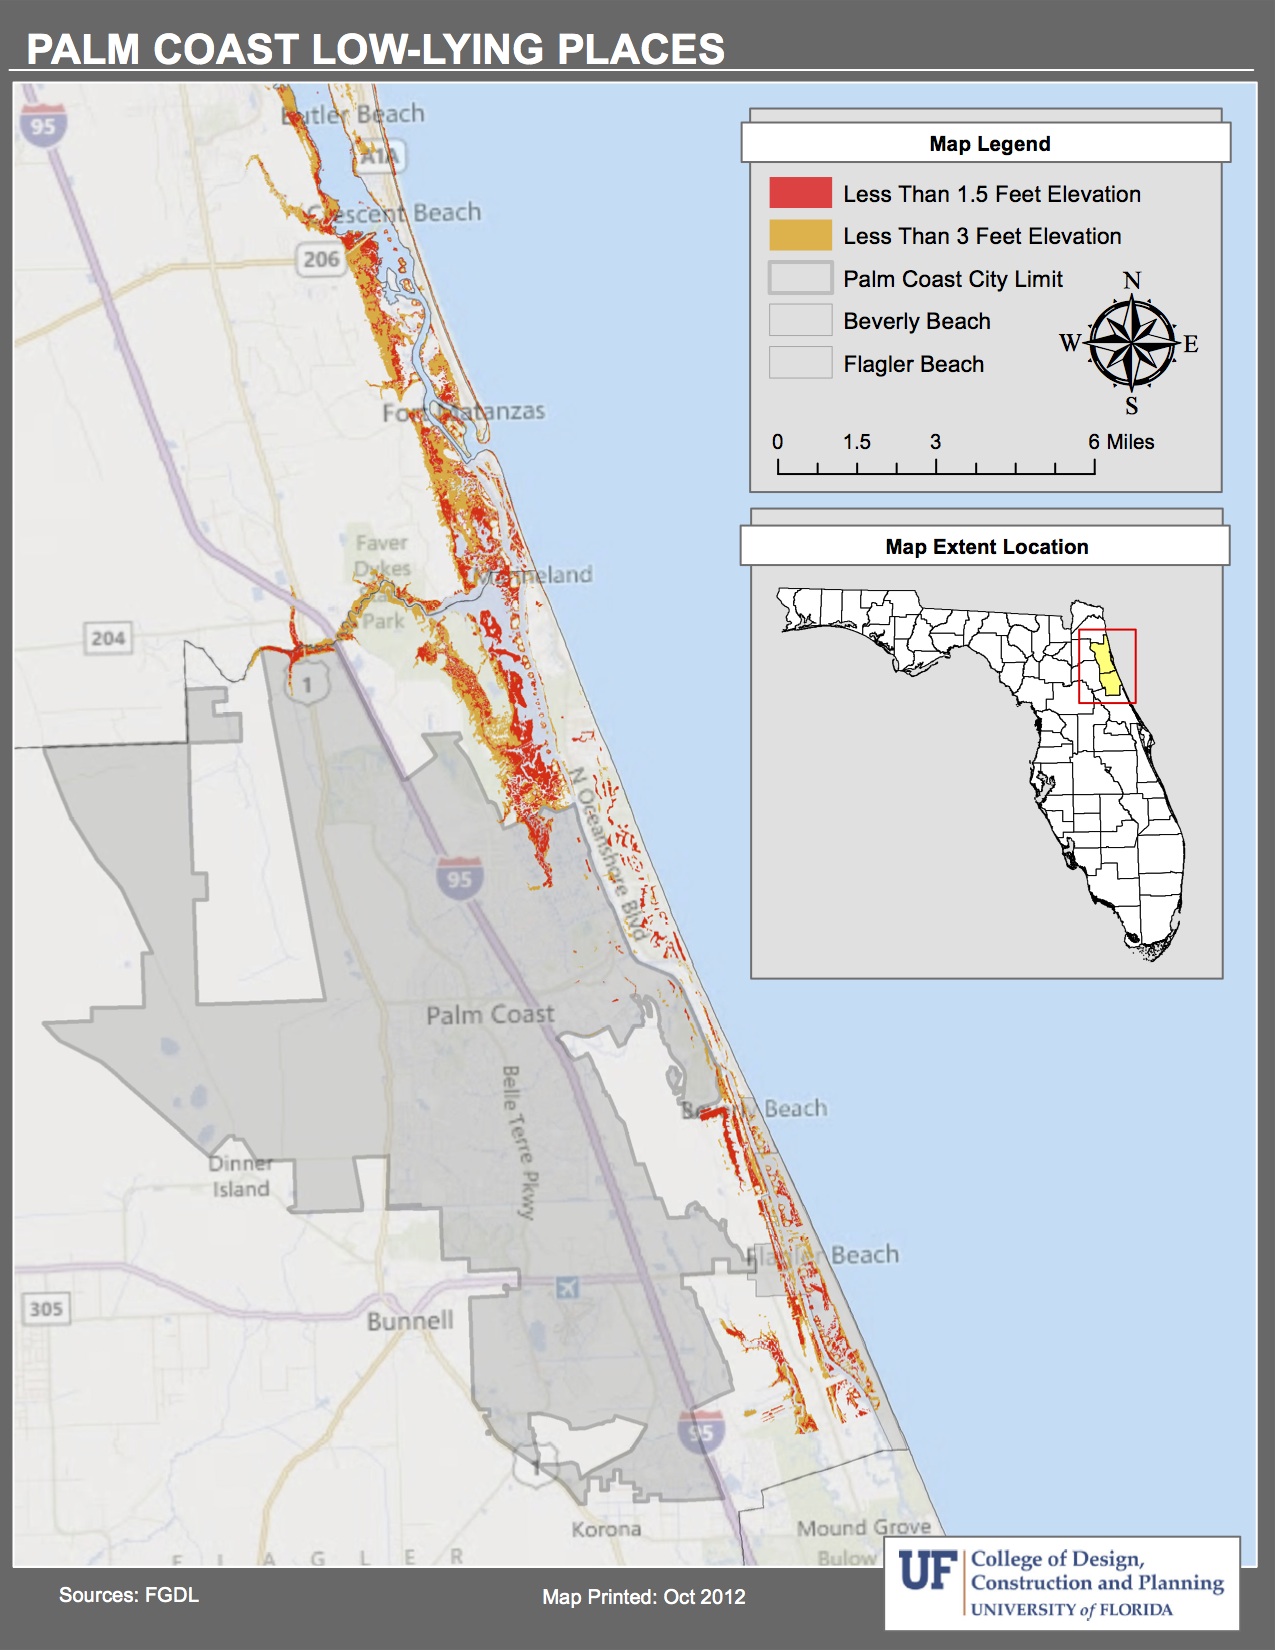 Palm Coast Low-Lying Places – areas below 1.5 ft and 3 ft of elevation in the City of Palm Coast.
SLAMM (Sea Level Rise Affecting Marshes Model)
The SLAMM model predicts habitat changes that will occur when sea levels rise. Certain barriers, such as seawalls or development, can prevent habitats from migrating which can result in a loss of that habitat entirely. Habitat migration is an important process for maintaining populations of plant and animal species. Data from SLAMM can help illustrate where future land conflicts may occur between development and natural ecosystems.

1 Meter SLAMM comparison maps for the study area – present habitat compared to habitat shifts with 1 m of sea level rise by 2100
 1 Meter SLAMM comparison maps for St. Augustine – present habitat compared to habitat shifts with 1 m of sea level rise by 2100

1 Meter SLAMM comparison maps for the GTM NERR – present habitat compared to habitat shifts with 1 m of sea level rise by 2100

1 Meter SLAMM comparison maps for Pellicer Creek – present habitat compared to habitat shifts with 1 m of sea level rise by 2100

1 Meter SLAMM comparison maps for Palm Coast – present habitat compared to habitat shifts with 1 m of sea level rise by 2100

1 Meter SLAMM with Critical Sites – habitat shifts with 1 m of sea level rise by 2100.
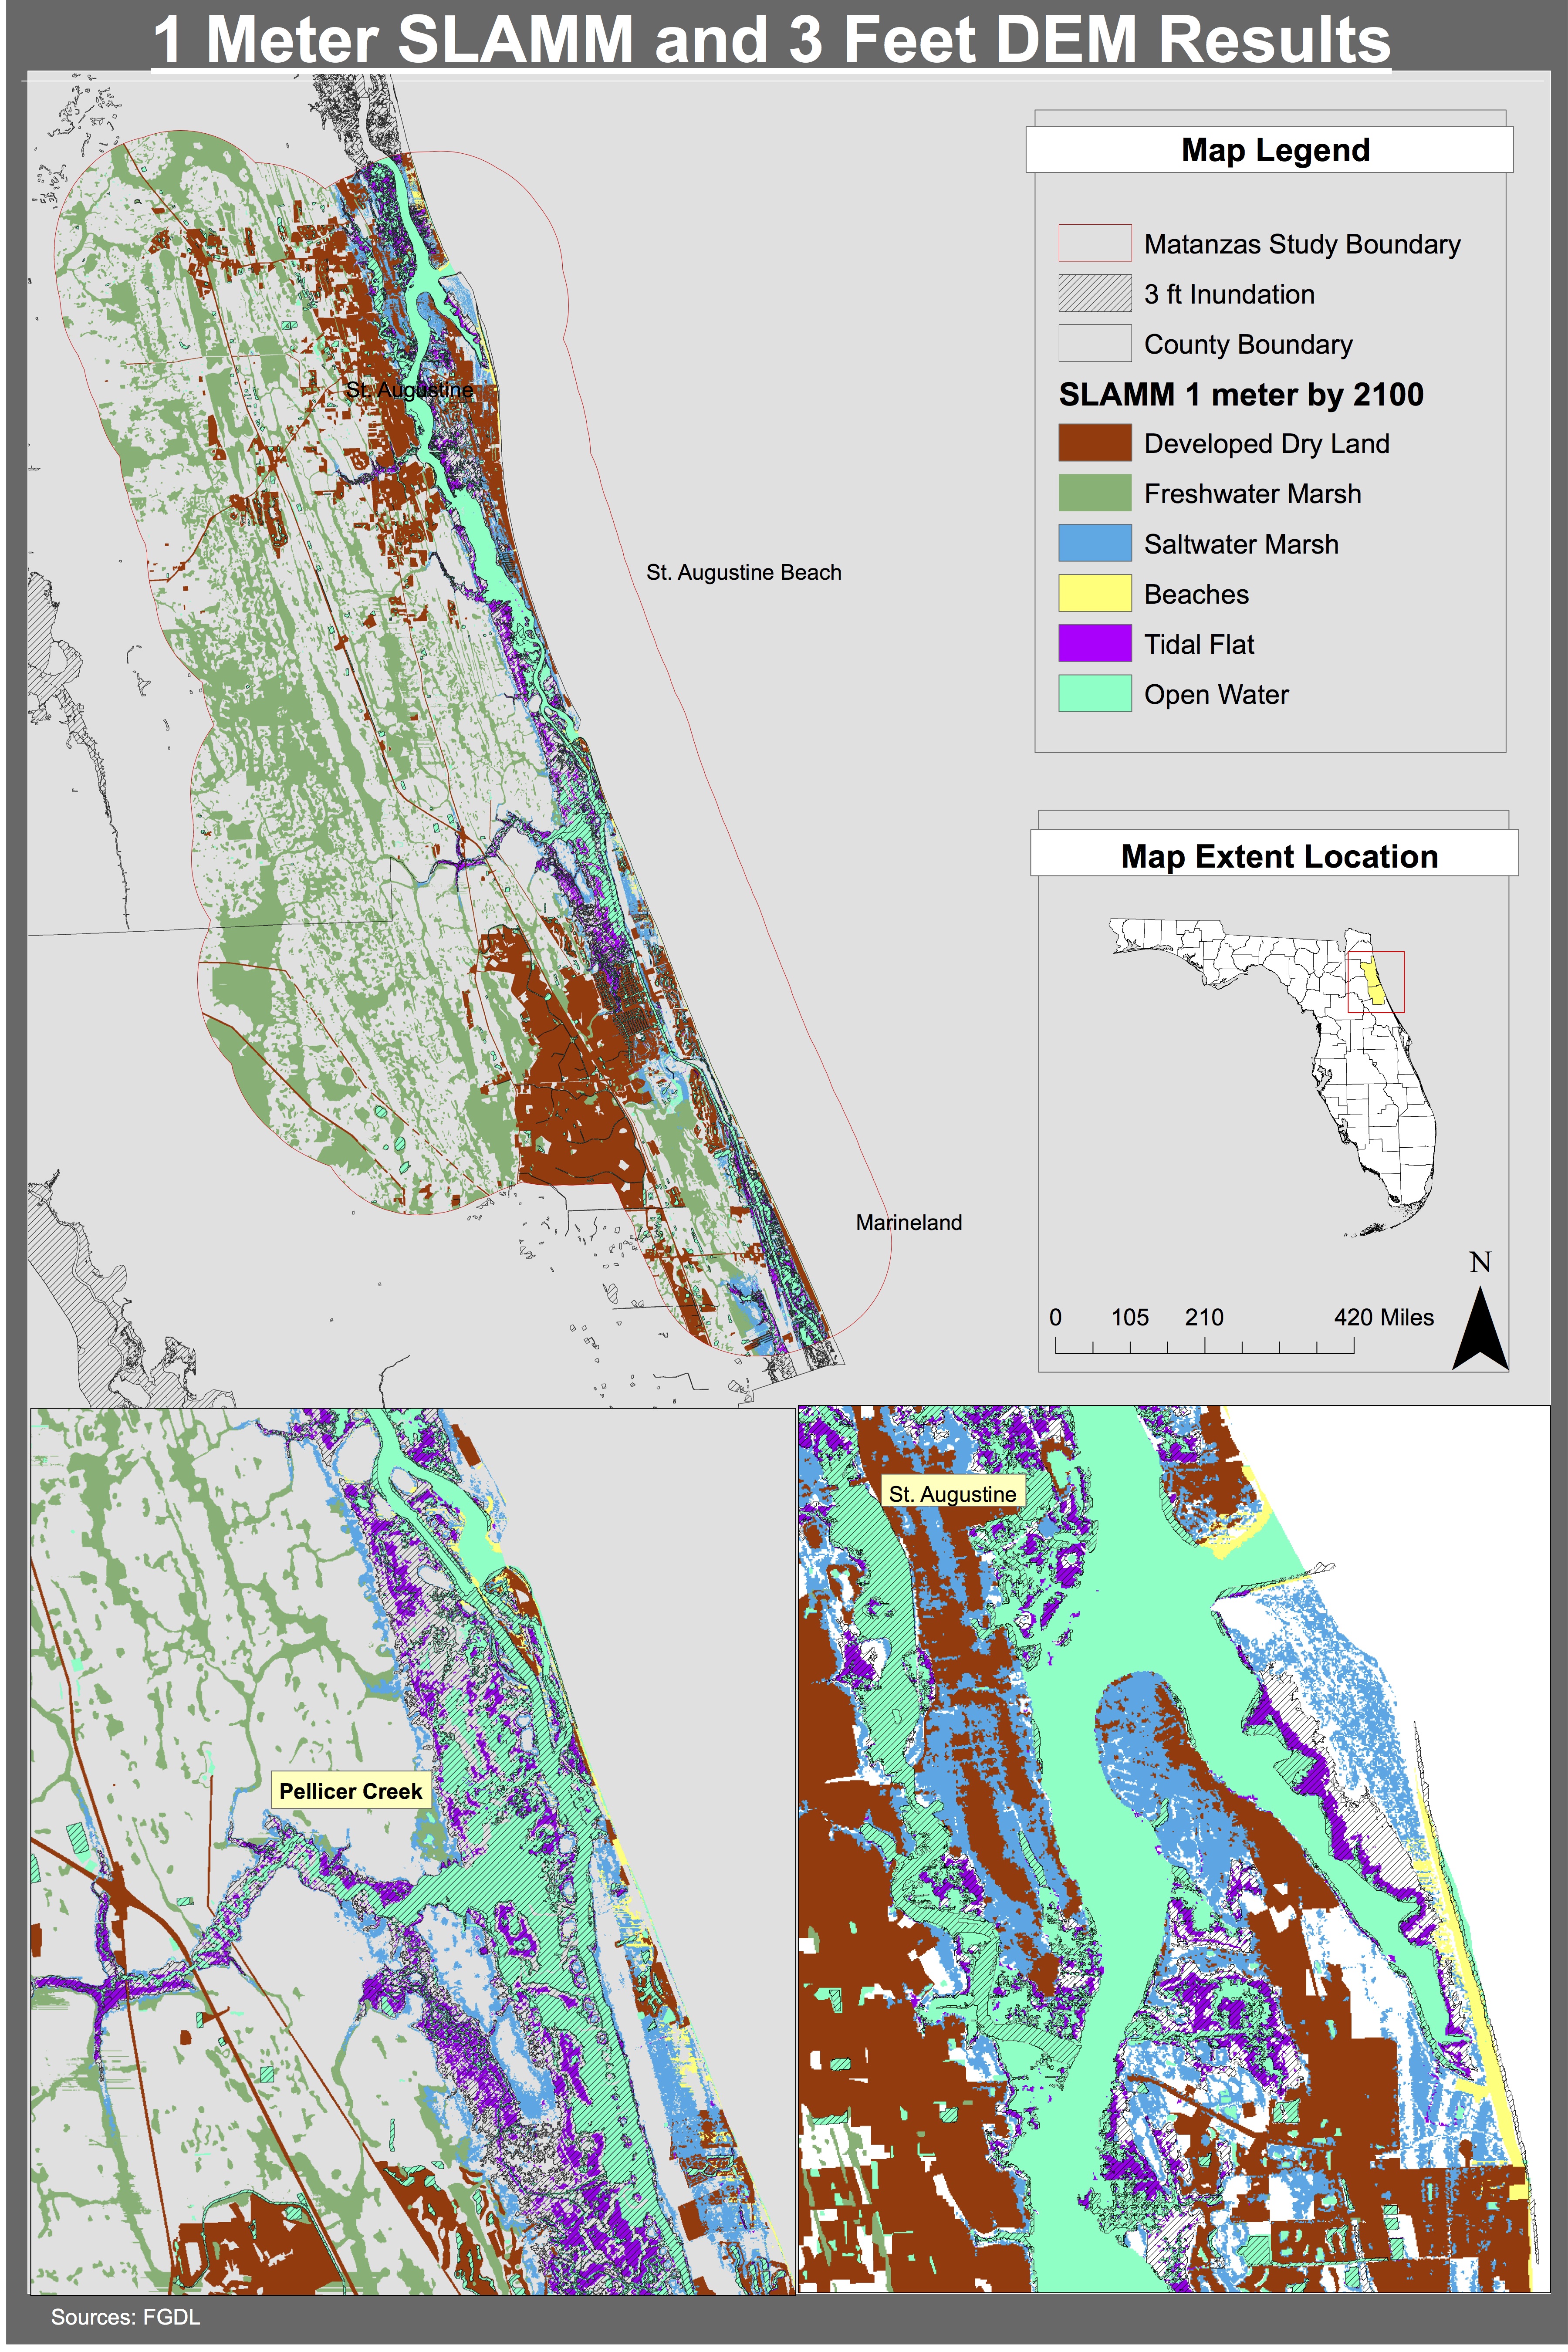 1 Meter SLAMM and 3 ft DEM – habitat shifts with 1 m of sea level rise by 2100. Includes an overlay of areas below 3 ft of elevation.
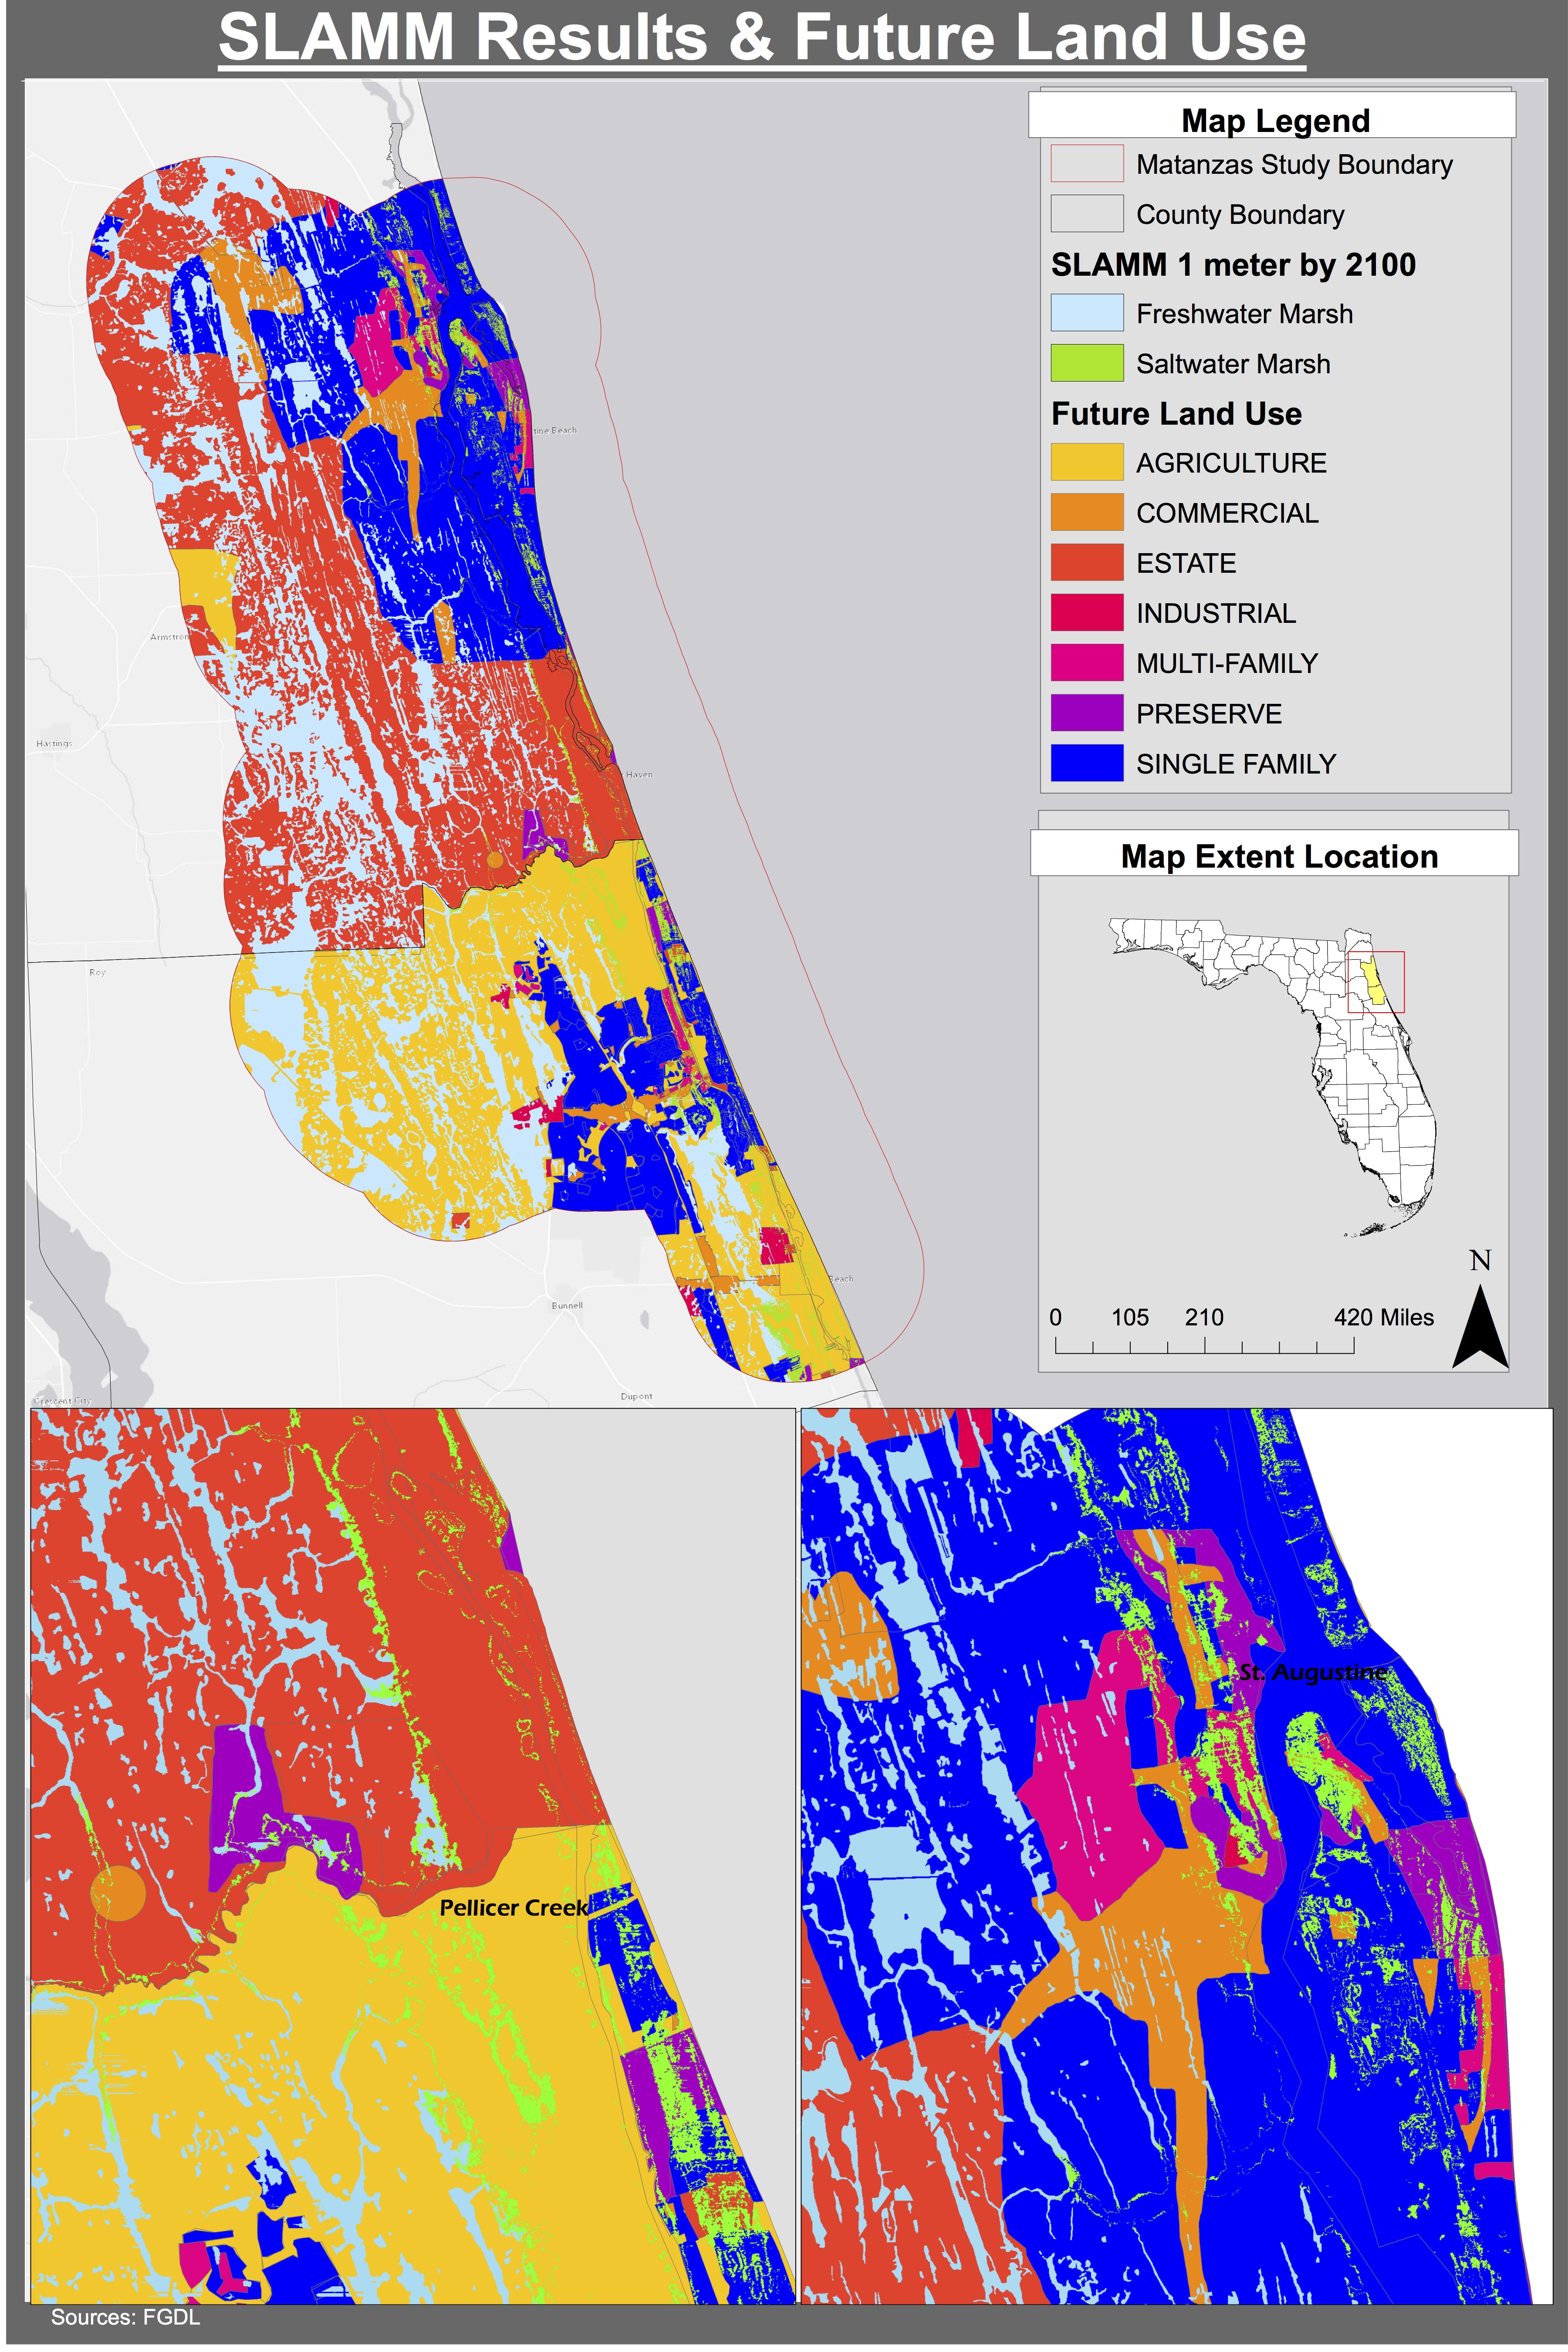
SLAMM Results and Future Land Use – areas of saltwater and freshwater marshes by 2100 with future land use.
Future Land Use and Sea Level Rise
Future land use plans guide development in a community by envisioning where we will live, work, and play in the future. Designating areas for different types of future land uses, such as agriculture or commercial, help our cities direct development appropriately to create our desired future. For instance, community leaders will target areas designated with a future land use of “commercial” with specific policies for creating and supporting commercial uses in that area. The maps below illustrate where land may inundated by loss to sea level rise where future land uses will be impacted by sea level rise

Future Land Use Impacted by 3 ft of SLR – areas below 3 ft of elevation in the study area
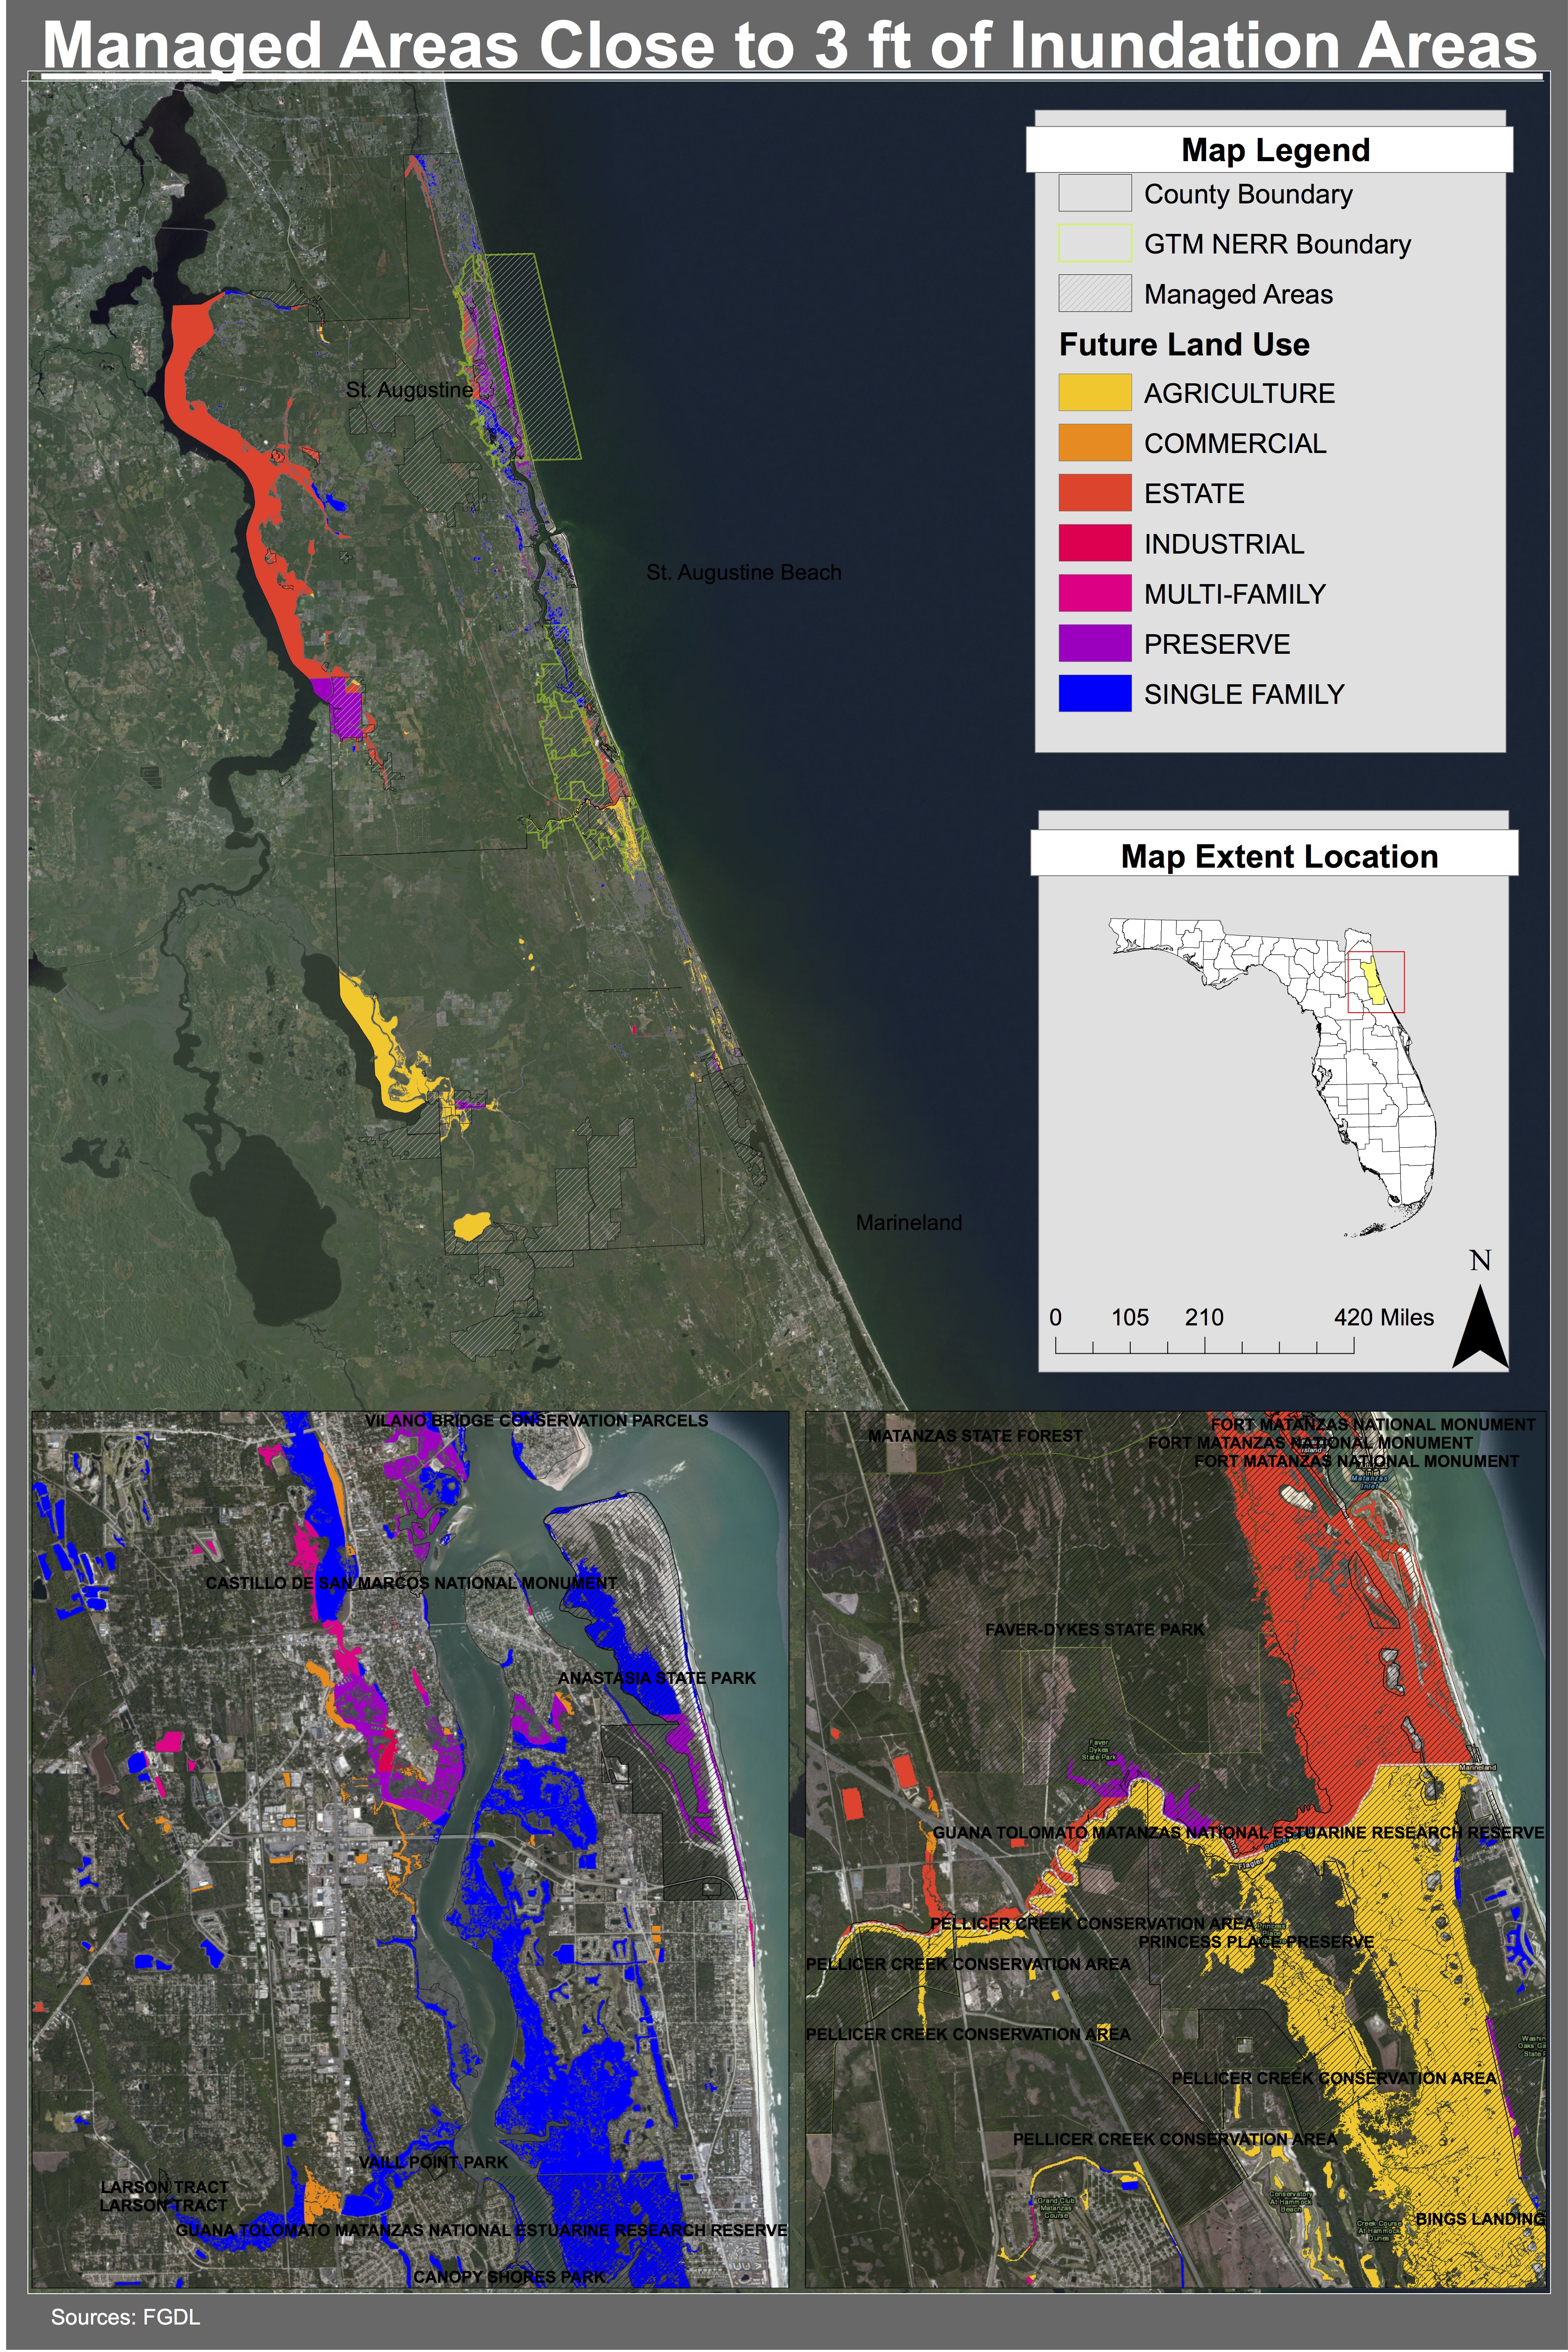 Managed Areas Close to Places of 3 ft Inundation – areas of managed land that are below 3 ft of elevation, making the susceptible to sea level rise
Coming soon…
Storm Surge

